Introduction
Digital products generate large volumes of behavioral data. Websites, mobile applications, and SaaS platforms record interactions such as clicks, page visits, feature usage, and session duration. While this data can reveal patterns about how people interact with software, interpreting it in a meaningful way requires specialized tools.
The broader field of product analytics emerged to address this need. Traditional analytics platforms often focused on web traffic metrics such as page views and referral sources. However, modern digital services require deeper insights into user behavior, product engagement, and feature adoption. Companies increasingly rely on behavioral data to understand how users move through a product, where they encounter obstacles, and which features contribute to retention.
Platforms designed for product analytics aim to transform raw event data into structured insights. These tools help organizations examine user journeys, analyze conversion paths, and identify engagement trends over time. Among the platforms developed for this purpose is Amplitude, a data analytics system focused on understanding product usage patterns.
This article examines the structure, capabilities, and typical applications of Amplitude within the broader product analytics ecosystem.
What Is Amplitude?
Amplitude is a product analytics platform that collects, organizes, and analyzes behavioral data generated by users interacting with digital products. The platform focuses on event-based analytics, meaning it tracks specific actions taken by users rather than relying solely on page-level metrics.
Organizations integrate Amplitude with websites, mobile applications, and backend systems to record events such as:
- Button clicks
- Page visits
- Feature interactions
- Account creation steps
- Purchase or subscription actions
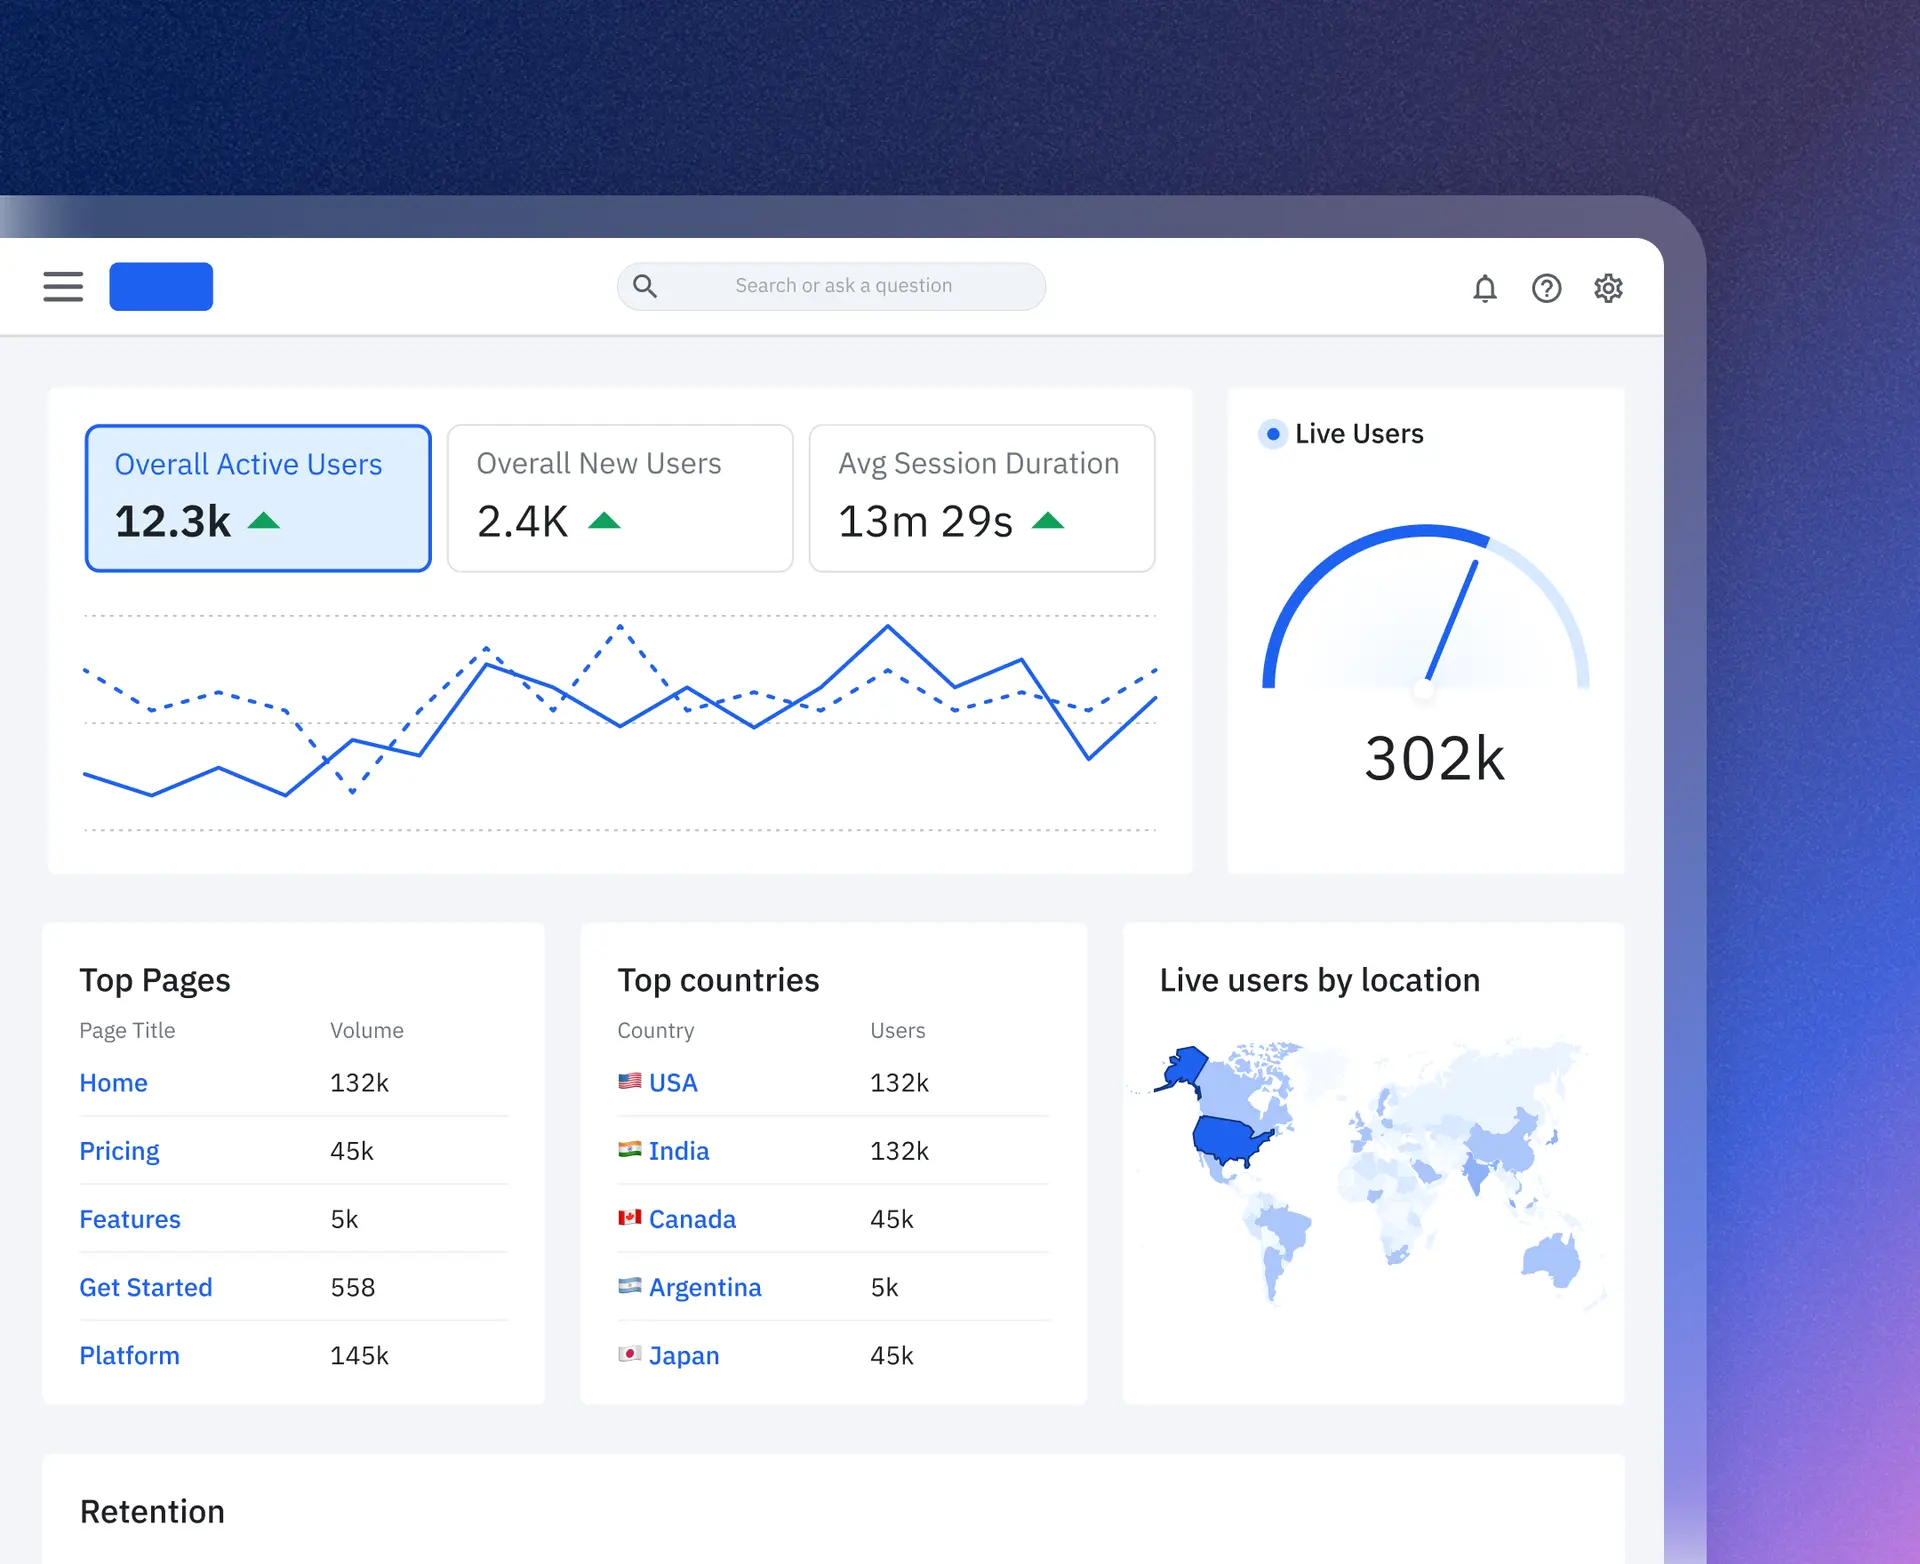
Once these events are captured, the platform processes them into visual reports and analytical models. This allows teams to examine user engagement trends, monitor product performance, and evaluate how design changes influence behavior.
In the broader analytics landscape, Amplitude is typically classified as a product analytics and behavioral intelligence platform. Unlike traditional web analytics systems that focus mainly on traffic measurement, product analytics tools emphasize user journeys, feature usage, and retention patterns.
Because the platform tracks individual user actions across sessions and devices, it is frequently used by product teams, analysts, and engineers who need to understand how people interact with digital products over time.
Key Features Explained
Event-Based Data Tracking
One of the core components of Amplitude is its event tracking framework. Instead of measuring only page views, the system records discrete user actions known as events.
Examples of events may include:
- Opening an application
- Clicking a feature button
- Completing a registration form
- Viewing a product page
- Sharing content
These events are stored with contextual information such as timestamps, device type, and user identifiers. Event-based tracking allows analysts to reconstruct detailed behavioral patterns.
Behavioral Cohort Analysis
Cohort analysis is a common technique used in product analytics. Amplitude enables teams to group users based on shared characteristics or behaviors.
Examples of cohorts include:
- Users who signed up during a specific month
- Users who used a certain feature within the first week
- Users who completed onboarding steps
Once defined, these cohorts can be analyzed to observe how engagement, retention, or conversion rates change over time.
User Journey Visualization
Understanding how users move through a product interface is often essential for product design and optimization. Amplitude includes tools for mapping user journeys, which illustrate the sequence of events users follow when interacting with an application.
These visualizations can highlight:
- Typical navigation paths
- Points where users abandon tasks
- Steps that contribute to successful conversions
By examining journey patterns, product teams can identify friction points within workflows.
Retention Analysis
Retention analysis focuses on measuring whether users return to a product after their initial interaction.
Amplitude includes retention tracking features that allow analysts to measure:
- Daily active users
- Weekly or monthly retention
- Returning user patterns
- Feature-driven engagement
Retention analysis helps determine whether users continue to find value in a product after the first experience.
Funnel Analysis
Funnel analysis is used to examine step-by-step processes such as sign-up flows, purchases, or onboarding sequences.
Within Amplitude, funnels can be configured to represent specific event sequences. Analysts can then measure:
- Completion rates for each step
- Drop-off points
- Time taken between steps
Funnel analysis helps identify obstacles that prevent users from completing key actions.
Experimentation and Product Insights
Many product teams rely on experimentation to test new features or design changes. Amplitude provides analytical tools that can evaluate how user behavior shifts after updates or feature releases.
These capabilities may support activities such as:
- Feature performance evaluation
- Engagement monitoring after product updates
- Behavioral comparisons across user segments
Experimentation data can inform future product development decisions.
Common Use Cases
Product Development Analysis
Product teams frequently use Amplitude to observe how users interact with newly introduced features. By tracking event data, teams can determine whether features are adopted or ignored.
This information can guide decisions about future development priorities.
User Onboarding Evaluation
Onboarding processes are critical for digital products. Amplitude’s funnel and event tracking tools can measure how users progress through onboarding steps.
Organizations may use these insights to identify steps that cause confusion or abandonment.
Feature Adoption Tracking
Digital products often introduce new tools or functionality over time. Amplitude allows analysts to track how frequently users engage with specific features.
This helps determine whether a feature is widely adopted or limited to a small group of users.
Retention and Engagement Monitoring
Retention metrics can reveal whether a product continues to deliver value to users. Amplitude’s retention analysis tools allow teams to observe engagement patterns across days, weeks, or months.
Such data may inform product adjustments aimed at improving long-term user engagement.
Marketing and Growth Analysis
Although Amplitude is primarily focused on product analytics, it can also be used to examine behavioral patterns related to growth initiatives.
Examples include:
- Evaluating campaign-driven signups
- Tracking engagement after marketing initiatives
- Analyzing referral or sharing behaviors
These insights can complement marketing analytics systems.
Potential Advantages
Behavioral Data Depth
Because Amplitude relies on event-based tracking, it captures detailed behavioral information. This allows analysts to explore how individual actions contribute to broader engagement patterns.
Flexible Segmentation
The platform supports segmentation of users by behavior, demographics, device type, or acquisition channel. This flexibility can make it easier to identify patterns within specific user groups.
Visual Data Exploration
Many analytics platforms emphasize dashboards and charts to simplify data interpretation. Amplitude includes visualization tools that help analysts explore patterns without requiring complex queries.
These visual tools may support decision-making among non-technical teams.
Cross-Platform Tracking
Amplitude can track events across different environments, including web applications, mobile apps, and backend systems. This enables organizations to analyze behavior across multiple platforms within a single dataset.
Long-Term Product Insights
Because behavioral data is recorded over time, the platform can reveal long-term trends related to retention, feature usage, and product lifecycle patterns.
Such insights may be useful when evaluating the impact of product changes.
Limitations & Considerations
Implementation Complexity
Event-based analytics systems often require careful planning during implementation. Organizations must define which user actions should be tracked and ensure events are consistently recorded.
Incomplete or poorly structured event tracking can reduce the reliability of insights.
Data Interpretation Challenges
Although behavioral analytics tools provide large volumes of data, interpreting that data requires analytical expertise. Misinterpretation of behavioral metrics may lead to incorrect conclusions about user behavior.
Data Volume Management
As products scale, event tracking can generate very large datasets. Organizations may need strategies for managing data storage, event schemas, and query performance.
Integration Requirements
Amplitude is often used alongside other tools such as data warehouses, marketing platforms, and customer relationship systems. Integrating these systems may require technical resources.
Privacy and Compliance
Collecting user behavior data introduces privacy considerations. Organizations using analytics platforms must ensure compliance with data protection regulations and internal privacy policies.
Who Should Consider Amplitude
Amplitude may be relevant for organizations that rely heavily on data-driven product development.
Examples include:
- SaaS companies analyzing feature engagement
- Mobile application teams studying user retention
- Digital platforms evaluating onboarding flows
- Product managers seeking behavioral insights
Teams responsible for product design, analytics, and growth strategy may find event-based analytics useful when evaluating user interactions.
Organizations with established data infrastructure are typically better positioned to integrate and interpret behavioral analytics tools.
Who May Want to Avoid It
Not every organization requires advanced product analytics systems.
Situations where Amplitude may be less relevant include:
- Small websites focused primarily on traffic measurement
- Projects that only need basic page-view analytics
- Organizations without technical resources to implement event tracking
- Teams that rely mainly on qualitative feedback rather than behavioral data
In such cases, simpler analytics tools may be sufficient.
Comparison With Similar Tools
The product analytics landscape includes several platforms designed to analyze user behavior within digital products. While these tools share similar goals, they often differ in implementation approach, reporting features, and analytical focus.
Some product analytics platforms emphasize session-based tracking, which focuses on page visits and navigation flows. Others rely on event-driven models, which capture individual actions performed by users.
Event-driven analytics platforms generally provide more granular behavioral insights but may require more extensive setup during integration.
Another distinction involves data accessibility. Some platforms integrate tightly with data warehouses, allowing organizations to analyze raw behavioral data alongside other datasets. Others operate as standalone analytics systems with built-in reporting tools.
When evaluating analytics tools, organizations often consider factors such as:
- Data collection methodology
- Visualization capabilities
- Integration with existing data infrastructure
- Scalability for large datasets
- Reporting flexibility
Amplitude is typically evaluated within this broader ecosystem of behavioral analytics platforms.
Final Educational Summary
The growth of digital services has increased the importance of understanding how users interact with software products. Behavioral data provides insights into engagement patterns, product usability, and feature adoption.
Amplitude represents one category of analytics platforms designed specifically for product behavior analysis. By focusing on event-based tracking, the platform enables organizations to examine user journeys, analyze conversion funnels, and study long-term retention trends.
Through features such as cohort analysis, journey visualization, and funnel reporting, Amplitude provides tools for interpreting large volumes of behavioral data. These capabilities are commonly used by product teams seeking to evaluate how design decisions influence user engagement.
However, event-based analytics platforms also require thoughtful implementation. Organizations must define meaningful events, ensure consistent tracking, and interpret data within the appropriate context. Without clear analytical frameworks, behavioral data can be difficult to interpret effectively.
Within the broader field of product analytics, Amplitude functions as one approach to analyzing user interactions across digital products. Its usefulness depends largely on an organization’s analytical goals, data infrastructure, and product development processes.
Disclosure: This article is for educational and informational purposes only. Some links on this website may be affiliate links, but this does not influence our editorial content or evaluations.